
A web route-planning interface that cut planning time by 40x
Period
June — August 2022
Company
Samokat, instant grocery delivery
Users
Store managers and staff
Role
Senior Product Designer
Summary
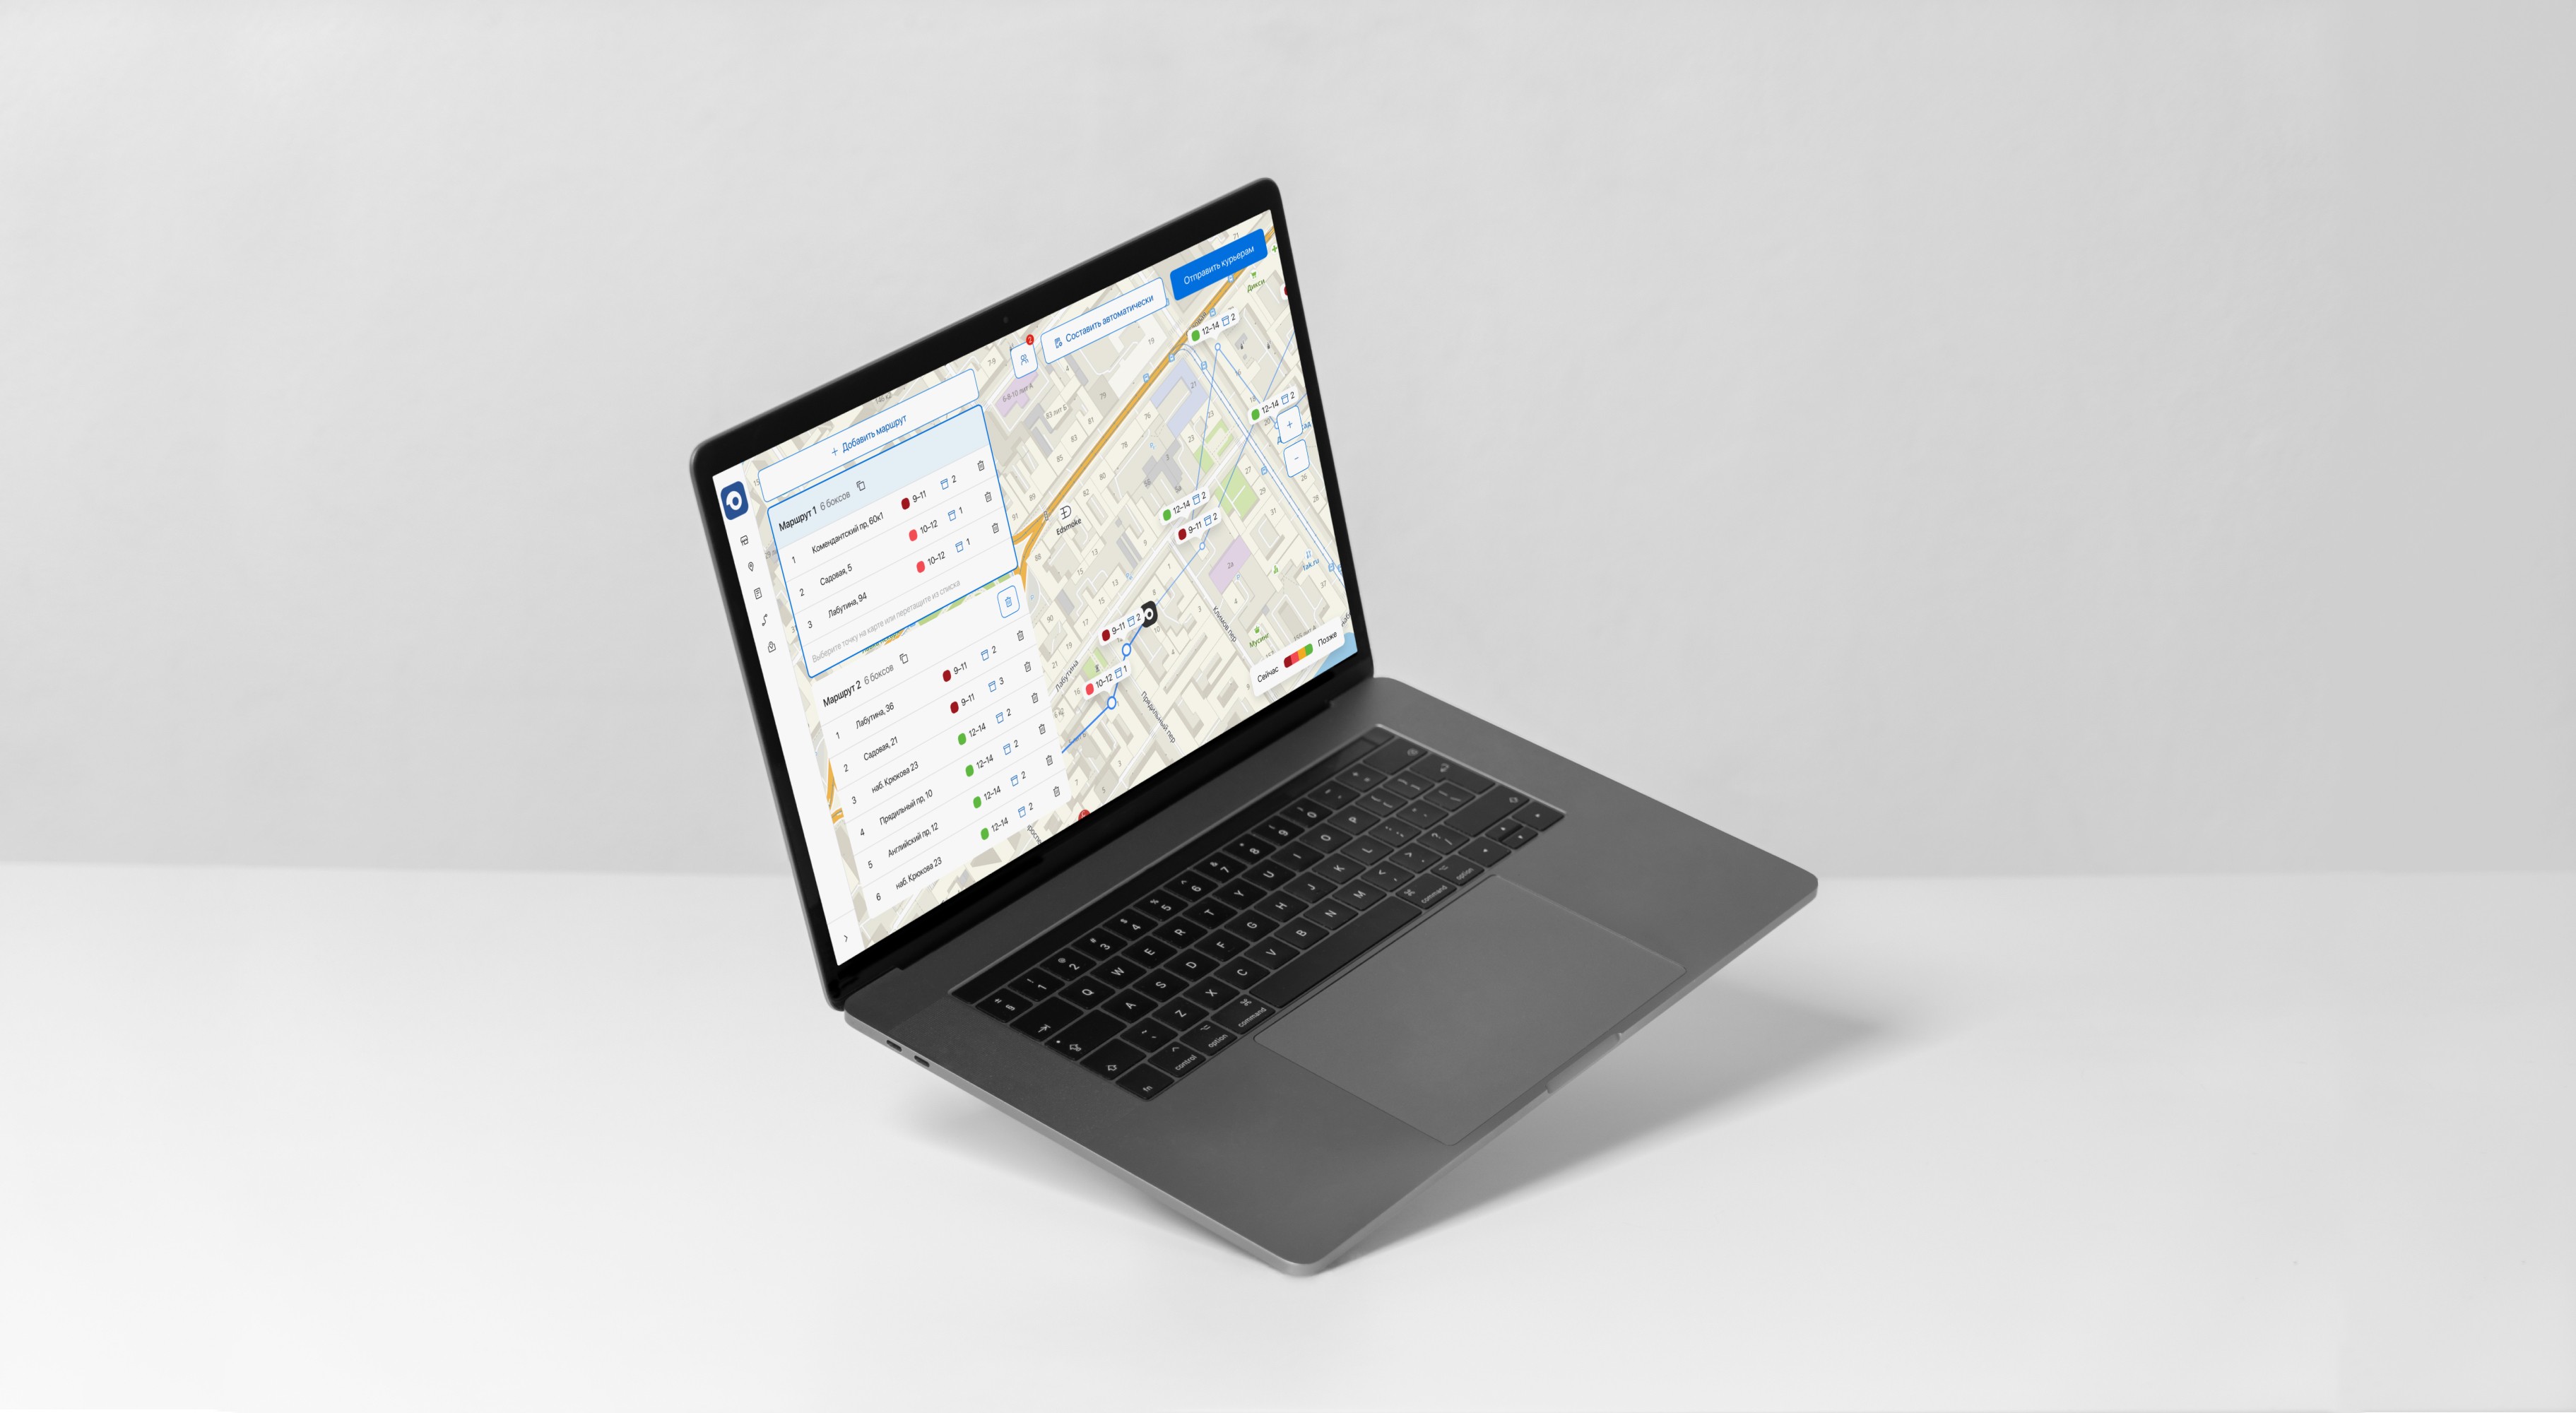
I led the design of a routing tool for a new business line with a different operating model. Together with the team, we delivered a first version in just three weeks that allowed managers to view orders on a map, then quickly followed with a version that supported route planning. This was enough for the business to test the new model, assess demand, and make informed decisions about further investment.
1 week
to design the first version
40×
faster route planning
Context
In spring 2022, consumer behavior patterns shifted. The customer experience team conducted research and identified a trend toward small-wholesale purchases and growing demand for discounted goods. The company decided to test a new business model: next-day delivery of small-wholesale essentials at lower prices, unlike its core 15-minute convenience model.
Goal
The goal was to enable fast, reliable route planning by giving logisticians a simple tool that reduced manual effort and errors, despite extreme time constraints and the lack of existing processes, algorithms, or live users.
The challenge
We had to build two key solutions: enhancements to the mobile app for picking and delivery, and a routing tool for logisticians to help plan optimal delivery routes. Timelines were very tight: the MVP release was planned in 3 weeks, and the new service launch in a month. Complicating matters, we needed to define the business process, determine the core functionality, and design a minimal solution all at once.
Key changes to the business model:
- Larger order volumes
- Delivery in a scheduled time slot rather than in 15 minutes
- Using cars instead of bicycles
- Expanded delivery area
- Route optimization to reduce delivery costs
The store managers’ task was to manually plan and adjust delivery routes by grouping orders by time slots, volume, and geography to minimize delivery time and costs.
Research
We had to quickly learn a new domain almost from scratch and invent user stories because the project wasn’t live yet, which meant we couldn’t study our users directly.
Since we lacked prior experience with map-based products, the team analyzed analogous solutions:
- The junior designer and I analyzed mapping interfaces (Google Maps, Yandex.Maps, 2GIS) to identify necessary functionality, UX patterns, and UI approaches.
- The product manager and business analyst examined logistics tools and routing algorithms.
Analysis of mapping services
Defining the MVP
While shaping the solution, we faced an important question: what is the minimal solution that can be considered an MVP—a minimally valuable, or at least viable, product—given limited time and resources?
We understood that once the new service reached peak demand, the target solution would be:
- Fully automated—the algorithm computes optimal routes and hands them off to couriers, with no routing UI required, or
- Partially automated—the algorithm proposes routes and a logistician tweaks them in the interface.
Options
Integrating or refining routing algorithms would take over a month, which we didn’t have. We needed to give logisticians something usable at launch. I therefore considered two MVP options:
- The most basic: a map with marked orders and no routing. The logistician manually groups orders, notes routes, and uses third-party tools (e.g., notes or route building in 2GIS).
- More convenient but resource-intensive: a tool with an interactive routes panel to add, reorder, and manage orders.
MVP option 1
MVP option 2
There was no time to fully design a routing interface. After aligning with the team, we split the MVP into two parts: first deliver the basic map and immediately start designing the more convenient version. By giving logisticians a stopgap tool, we could at least ease route planning at launch.
Basic version
The first version was a map with order pins:
- Orders appeared as pins.
- Each order pin showed minimal info (address, time slot, volume).
A logistician could visually assess delivery order and proximity, then copy addresses to an external service to build routes.
My teammates suggested using rainbow-style color coding to indicate order priority (e.g., red for the nearest time slot, orange for the next, etc.). I was skeptical: even with a legend, users would need to remember the color sequence and map it to time slots. Not everyone easily distinguishes adjacent colors, and too many colors reduce visual clarity.
Order pins map (basic version)
We settled on a compromise for the next release: four colors to encode the nearest time slots—simpler to read and less visually noisy.
Testing the first iteration
After the front-end map was implemented, we tested it with users and got discouraging results: the tool was inconvenient. Without routing, the map was hard to use. The solution didn’t meet MVP criteria, and the hypothesis that we needed a proper routing interface was confirmed.
User quotes from testing the first version
Users had to assemble routes in third-party services by copying our order data, since our tool only solved displaying orders on the map and their time slots.
We also found several smaller issues:
- Without a native tutorial, users didn’t understand what to do with the map.
- Clusters of multiple orders were easy to miss.
- The legend went unnoticed by some respondents.
Manual route planning
While the front-end engineer coded the basic iteration, we started designing the second. We listed the required functions and elements and prioritized them using a User Story Map.
User story map for route planning
First, we added a routes panel where a logistician could create routes, add and remove orders, reorder within a route, and move orders between routes.
Filling the route list using drag-and-drop
We visualized routes on the map and visually distinguished the active route. Orders could also be added by tapping pins directly on the map—making it easier to match pins to the highlighted route.
Displaying route chains on a map
Testing the second iteration
By the time the second-iteration design was ready, the project had launched and warehouses were delivering. We tested prototypes with real users and collected feedback.
Results:
- Storekeepers unequivocally appreciated seeing the order list and routes—“No need to jump to 2GIS.”
- The hypothesis was confirmed that only the nearest time windows need to be visible when building routes—“I only need the next two, otherwise frozen goods will thaw.”
- Still missing: estimated route duration and road-based routing (not straight-line “as the crow flies”).
This solution was far better because it provided the critical functionality the first version lacked. We made key fixes and handed the second iteration to development.
Automation
While we designed iteration two, engineers worked on integrating off-the-shelf routing services.
In the final version, we implemented partial automation. Order and courier data flowed into a routing algorithm that computed optimal routes; a logistician could then edit them on the map.
Automatic route generation with manual adjustment
We also added route dispatch to couriers—so couriers received ready-made sequences in the mobile app and didn’t have to find their orders in the general stream.
Feedback on the final iteration
We adapted the map for algorithm integration, retested, and gathered feedback. To our surprise, users didn’t value automatic routing—order volume was low, and manual route building took the same or even less time. Key insights:
- Many errors and bugs right after release undermined trust in the algorithm.
- Manually entering courier shifts took extra time.
- Automatic routing didn’t account for additional errands assigned to couriers after deliveries.
- At small volumes (under 50 orders), manual routing is faster than pressing “Auto-calculate,” waiting, and then double-checking.
We deferred this version until scale-up, when volumes would be high enough to make manual routing impractical.
Outcome
Although we didn’t use event tracking for analytics, we were able to evaluate the results based on user surveys. Comparing the first and second iterations, time spent planning routes dropped by a factor of 40—from 2 hours to 3 minutes.
However, despite the successful development of the tool, the business hypothesis didn’t hold—the demand for the new delivery format proved insufficient for this model. The small-wholesale project was closed, but the routing tool lived on and was used in other company projects that required planning vehicle delivery routes in advance.
Explore more projects
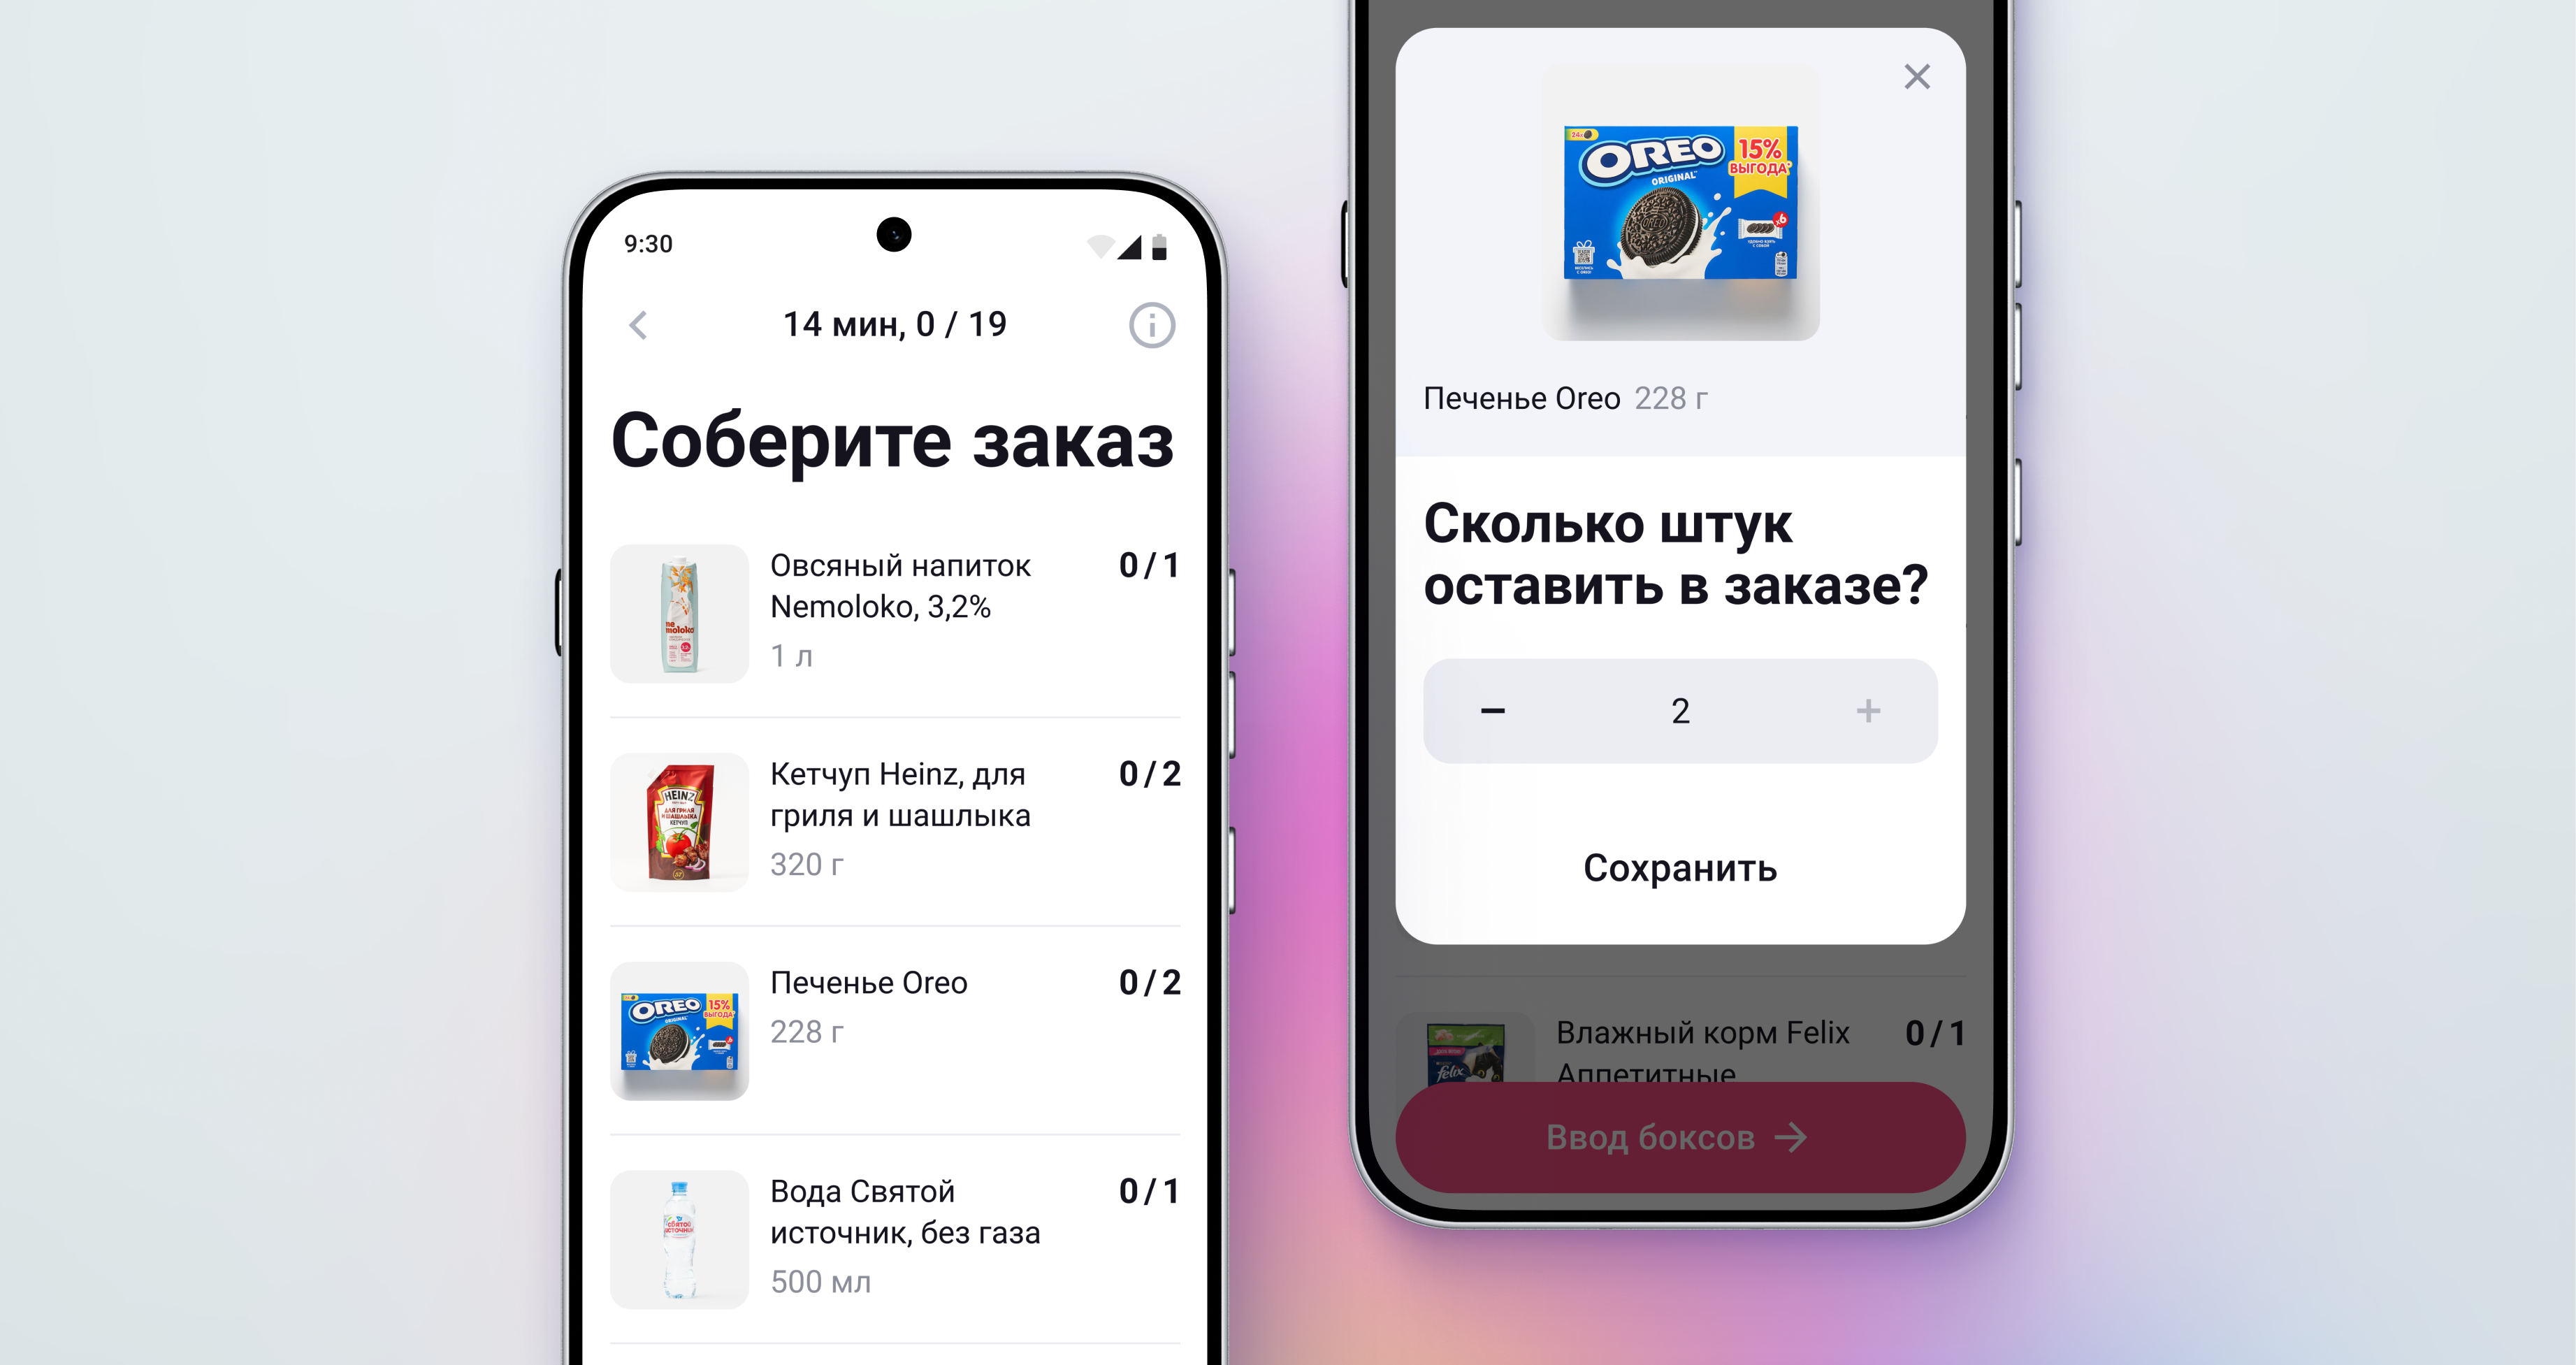
An app that made store operations faster and helped the business scale
Samokat delivery and store operations app
Read case study
Bonus: A new form factor for delivery bags that tripled order capacity
Delivery bags for Samokat couriers
Read case study
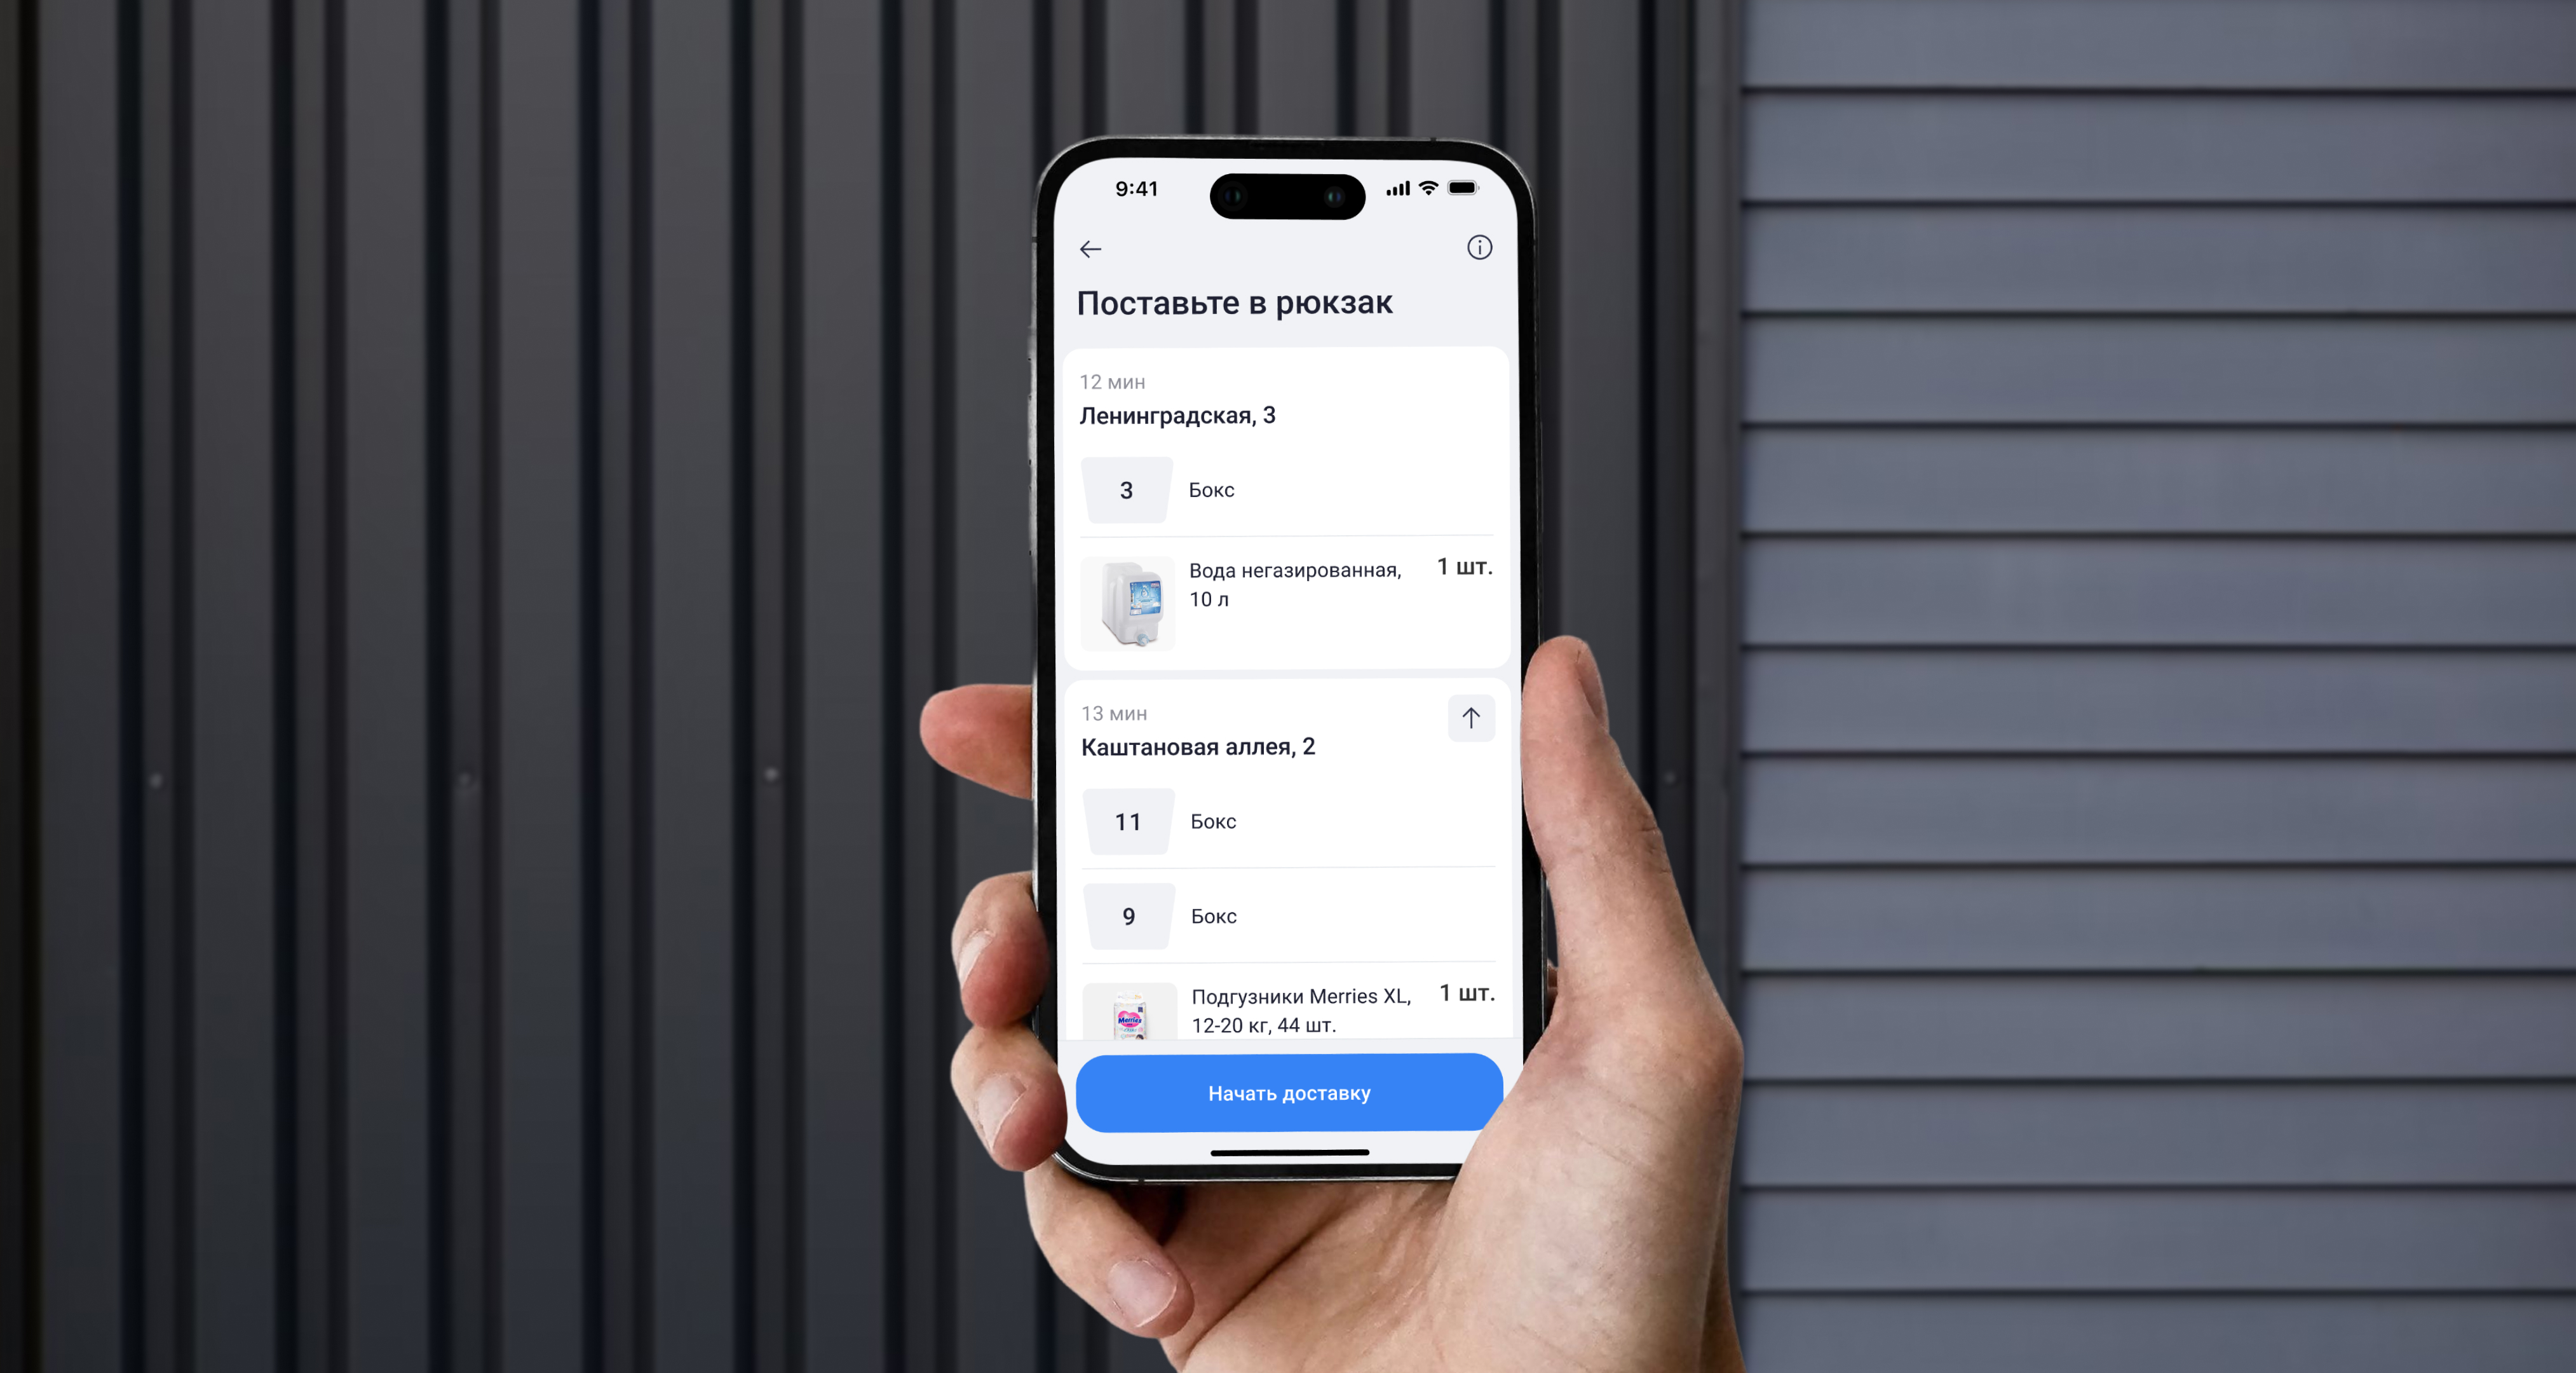
A React Native migration that expanded the hiring funnel by 32%
New app for iOS for Samokat dark-stores
Read case study
A web route-planning interface that cut planning time by 40x
Period
June — August 2022
Company
Samokat, instant grocery delivery
Users
Store managers and staff
Role
Senior Product Designer
Summary
I led the design of a routing tool for a new business line with a different operating model. Together with the team, we delivered a first version in just three weeks that allowed managers to view orders on a map, then quickly followed with a version that supported route planning. This was enough for the business to test the new model, assess demand, and make informed decisions about further investment.
1 week
to design the first version
40×
faster route planning
Context
In spring 2022, consumer behavior patterns shifted. The customer experience team conducted research and identified a trend toward small-wholesale purchases and growing demand for discounted goods. The company decided to test a new business model: next-day delivery of small-wholesale essentials at lower prices, unlike its core 15-minute convenience model.
Goal
The goal was to enable fast, reliable route planning by giving logisticians a simple tool that reduced manual effort and errors, despite extreme time constraints and the lack of existing processes, algorithms, or live users.
The challenge
We had to build two key solutions: enhancements to the mobile app for picking and delivery, and a routing tool for logisticians to help plan optimal delivery routes. Timelines were very tight: the MVP release was planned in 3 weeks, and the new service launch in a month. Complicating matters, we needed to define the business process, determine the core functionality, and design a minimal solution all at once.
Key changes to the business model:
- Larger order volumes
- Delivery in a scheduled time slot rather than in 15 minutes
- Using cars instead of bicycles
- Expanded delivery area
- Route optimization to reduce delivery costs
The store managers’ task was to manually plan and adjust delivery routes by grouping orders by time slots, volume, and geography to minimize delivery time and costs.
Research
We had to quickly learn a new domain almost from scratch and invent user stories because the project wasn’t live yet, which meant we couldn’t study our users directly.
Since we lacked prior experience with map-based products, the team analyzed analogous solutions:
- The junior designer and I analyzed mapping interfaces (Google Maps, Yandex.Maps, 2GIS) to identify necessary functionality, UX patterns, and UI approaches.
- The product manager and business analyst examined logistics tools and routing algorithms.
Analysis of mapping services
Defining the MVP
While shaping the solution, we faced an important question: what is the minimal solution that can be considered an MVP—a minimally valuable, or at least viable, product—given limited time and resources?
We understood that once the new service reached peak demand, the target solution would be:
- Fully automated—the algorithm computes optimal routes and hands them off to couriers, with no routing UI required, or
- Partially automated—the algorithm proposes routes and a logistician tweaks them in the interface.
Options
Integrating or refining routing algorithms would take over a month, which we didn’t have. We needed to give logisticians something usable at launch. I therefore considered two MVP options:
- The most basic: a map with marked orders and no routing. The logistician manually groups orders, notes routes, and uses third-party tools (e.g., notes or route building in 2GIS).
- More convenient but resource-intensive: a tool with an interactive routes panel to add, reorder, and manage orders.
MVP option 1
MVP option 2
There was no time to fully design a routing interface. After aligning with the team, we split the MVP into two parts: first deliver the basic map and immediately start designing the more convenient version. By giving logisticians a stopgap tool, we could at least ease route planning at launch.
Basic version
The first version was a map with order pins:
- Orders appeared as pins.
- Each order pin showed minimal info (address, time slot, volume).
A logistician could visually assess delivery order and proximity, then copy addresses to an external service to build routes.
My teammates suggested using rainbow-style color coding to indicate order priority (e.g., red for the nearest time slot, orange for the next, etc.). I was skeptical: even with a legend, users would need to remember the color sequence and map it to time slots. Not everyone easily distinguishes adjacent colors, and too many colors reduce visual clarity.
Order pins map (basic version)
We settled on a compromise for the next release: four colors to encode the nearest time slots—simpler to read and less visually noisy.
Testing the first iteration
After the front-end map was implemented, we tested it with users and got discouraging results: the tool was inconvenient. Without routing, the map was hard to use. The solution didn’t meet MVP criteria, and the hypothesis that we needed a proper routing interface was confirmed.
User quotes from testing the first version
Users had to assemble routes in third-party services by copying our order data, since our tool only solved displaying orders on the map and their time slots.
We also found several smaller issues:
- Without a native tutorial, users didn’t understand what to do with the map.
- Clusters of multiple orders were easy to miss.
- The legend went unnoticed by some respondents.
Manual route planning
While the front-end engineer coded the basic iteration, we started designing the second. We listed the required functions and elements and prioritized them using a User Story Map.
User story map for route planning
First, we added a routes panel where a logistician could create routes, add and remove orders, reorder within a route, and move orders between routes.
Filling the route list using drag-and-drop
We visualized routes on the map and visually distinguished the active route. Orders could also be added by tapping pins directly on the map—making it easier to match pins to the highlighted route.
Displaying route chains on a map
Testing the second iteration
By the time the second-iteration design was ready, the project had launched and warehouses were delivering. We tested prototypes with real users and collected feedback.
Results:
- Storekeepers unequivocally appreciated seeing the order list and routes—“No need to jump to 2GIS.”
- The hypothesis was confirmed that only the nearest time windows need to be visible when building routes—“I only need the next two, otherwise frozen goods will thaw.”
- Still missing: estimated route duration and road-based routing (not straight-line “as the crow flies”).
This solution was far better because it provided the critical functionality the first version lacked. We made key fixes and handed the second iteration to development.
Automation
While we designed iteration two, engineers worked on integrating off-the-shelf routing services.
In the final version, we implemented partial automation. Order and courier data flowed into a routing algorithm that computed optimal routes; a logistician could then edit them on the map.
Automatic route generation with manual adjustment
We also added route dispatch to couriers—so couriers received ready-made sequences in the mobile app and didn’t have to find their orders in the general stream.
Feedback on the final iteration
We adapted the map for algorithm integration, retested, and gathered feedback. To our surprise, users didn’t value automatic routing—order volume was low, and manual route building took the same or even less time. Key insights:
- Many errors and bugs right after release undermined trust in the algorithm.
- Manually entering courier shifts took extra time.
- Automatic routing didn’t account for additional errands assigned to couriers after deliveries.
- At small volumes (under 50 orders), manual routing is faster than pressing “Auto-calculate,” waiting, and then double-checking.
We deferred this version until scale-up, when volumes would be high enough to make manual routing impractical.
Outcome
Although we didn’t use event tracking for analytics, we were able to evaluate the results based on user surveys. Comparing the first and second iterations, time spent planning routes dropped by a factor of 40—from 2 hours to 3 minutes.
However, despite the successful development of the tool, the business hypothesis didn’t hold—the demand for the new delivery format proved insufficient for this model. The small-wholesale project was closed, but the routing tool lived on and was used in other company projects that required planning vehicle delivery routes in advance.
Explore more projects
An app that made store operations faster and helped the business scale
Samokat delivery and store operations app
Read case study
Bonus: A new form factor for delivery bags that tripled order capacity
Delivery bags for Samokat couriers
Read case study
A React Native migration that expanded the hiring funnel by 32%
New app for iOS for Samokat dark-stores
Read case study
A web route-planning interface that cut planning time by 40x
Period
June — August 2022
Company
Samokat, instant grocery delivery
Users
Store managers and staff
Role
Senior Product Designer
Summary
I led the design of a routing tool for a new business line with a different operating model. Together with the team, we delivered a first version in just three weeks that allowed managers to view orders on a map, then quickly followed with a version that supported route planning. This was enough for the business to test the new model, assess demand, and make informed decisions about further investment.
1 week
to design the first version
40×
faster route planning
Context
In spring 2022, consumer behavior patterns shifted. The customer experience team conducted research and identified a trend toward small-wholesale purchases and growing demand for discounted goods. The company decided to test a new business model: next-day delivery of small-wholesale essentials at lower prices, unlike its core 15-minute convenience model.
Goal
The goal was to enable fast, reliable route planning by giving logisticians a simple tool that reduced manual effort and errors, despite extreme time constraints and the lack of existing processes, algorithms, or live users.
The challenge
We had to build two key solutions: enhancements to the mobile app for picking and delivery, and a routing tool for logisticians to help plan optimal delivery routes. Timelines were very tight: the MVP release was planned in 3 weeks, and the new service launch in a month. Complicating matters, we needed to define the business process, determine the core functionality, and design a minimal solution all at once.
Key changes to the business model:
- Larger order volumes
- Delivery in a scheduled time slot rather than in 15 minutes
- Using cars instead of bicycles
- Expanded delivery area
- Route optimization to reduce delivery costs
The store managers’ task was to manually plan and adjust delivery routes by grouping orders by time slots, volume, and geography to minimize delivery time and costs.
Research
We had to quickly learn a new domain almost from scratch and invent user stories because the project wasn’t live yet, which meant we couldn’t study our users directly.
Since we lacked prior experience with map-based products, the team analyzed analogous solutions:
- The junior designer and I analyzed mapping interfaces (Google Maps, Yandex.Maps, 2GIS) to identify necessary functionality, UX patterns, and UI approaches.
- The product manager and business analyst examined logistics tools and routing algorithms.
Analysis of mapping services
Defining the MVP
While shaping the solution, we faced an important question: what is the minimal solution that can be considered an MVP—a minimally valuable, or at least viable, product—given limited time and resources?
We understood that once the new service reached peak demand, the target solution would be:
- Fully automated—the algorithm computes optimal routes and hands them off to couriers, with no routing UI required, or
- Partially automated—the algorithm proposes routes and a logistician tweaks them in the interface.
Options
Integrating or refining routing algorithms would take over a month, which we didn’t have. We needed to give logisticians something usable at launch. I therefore considered two MVP options:
- The most basic: a map with marked orders and no routing. The logistician manually groups orders, notes routes, and uses third-party tools (e.g., notes or route building in 2GIS).
- More convenient but resource-intensive: a tool with an interactive routes panel to add, reorder, and manage orders.
MVP option 1
MVP option 2
There was no time to fully design a routing interface. After aligning with the team, we split the MVP into two parts: first deliver the basic map and immediately start designing the more convenient version. By giving logisticians a stopgap tool, we could at least ease route planning at launch.
Basic version
The first version was a map with order pins:
- Orders appeared as pins.
- Each order pin showed minimal info (address, time slot, volume).
A logistician could visually assess delivery order and proximity, then copy addresses to an external service to build routes.
My teammates suggested using rainbow-style color coding to indicate order priority (e.g., red for the nearest time slot, orange for the next, etc.). I was skeptical: even with a legend, users would need to remember the color sequence and map it to time slots. Not everyone easily distinguishes adjacent colors, and too many colors reduce visual clarity.
Order pins map (basic version)
We settled on a compromise for the next release: four colors to encode the nearest time slots—simpler to read and less visually noisy.
Testing the first iteration
After the front-end map was implemented, we tested it with users and got discouraging results: the tool was inconvenient. Without routing, the map was hard to use. The solution didn’t meet MVP criteria, and the hypothesis that we needed a proper routing interface was confirmed.
User quotes from testing the first version
Users had to assemble routes in third-party services by copying our order data, since our tool only solved displaying orders on the map and their time slots.
We also found several smaller issues:
- Without a native tutorial, users didn’t understand what to do with the map.
- Clusters of multiple orders were easy to miss.
- The legend went unnoticed by some respondents.
Manual route planning
While the front-end engineer coded the basic iteration, we started designing the second. We listed the required functions and elements and prioritized them using a User Story Map.
User story map for route planning
First, we added a routes panel where a logistician could create routes, add and remove orders, reorder within a route, and move orders between routes.
Filling the route list using drag-and-drop
We visualized routes on the map and visually distinguished the active route. Orders could also be added by tapping pins directly on the map—making it easier to match pins to the highlighted route.
Displaying route chains on a map
Testing the second iteration
By the time the second-iteration design was ready, the project had launched and warehouses were delivering. We tested prototypes with real users and collected feedback.
Results:
- Storekeepers unequivocally appreciated seeing the order list and routes—“No need to jump to 2GIS.”
- The hypothesis was confirmed that only the nearest time windows need to be visible when building routes—“I only need the next two, otherwise frozen goods will thaw.”
- Still missing: estimated route duration and road-based routing (not straight-line “as the crow flies”).
This solution was far better because it provided the critical functionality the first version lacked. We made key fixes and handed the second iteration to development.
Automation
While we designed iteration two, engineers worked on integrating off-the-shelf routing services.
In the final version, we implemented partial automation. Order and courier data flowed into a routing algorithm that computed optimal routes; a logistician could then edit them on the map.
Automatic route generation with manual adjustment
We also added route dispatch to couriers—so couriers received ready-made sequences in the mobile app and didn’t have to find their orders in the general stream.
Feedback on the final iteration
We adapted the map for algorithm integration, retested, and gathered feedback. To our surprise, users didn’t value automatic routing—order volume was low, and manual route building took the same or even less time. Key insights:
- Many errors and bugs right after release undermined trust in the algorithm.
- Manually entering courier shifts took extra time.
- Automatic routing didn’t account for additional errands assigned to couriers after deliveries.
- At small volumes (under 50 orders), manual routing is faster than pressing “Auto-calculate,” waiting, and then double-checking.
We deferred this version until scale-up, when volumes would be high enough to make manual routing impractical.
Outcome
Although we didn’t use event tracking for analytics, we were able to evaluate the results based on user surveys. Comparing the first and second iterations, time spent planning routes dropped by a factor of 40—from 2 hours to 3 minutes.
However, despite the successful development of the tool, the business hypothesis didn’t hold—the demand for the new delivery format proved insufficient for this model. The small-wholesale project was closed, but the routing tool lived on and was used in other company projects that required planning vehicle delivery routes in advance.
Explore more projects
An app that made store operations faster and helped the business scale
Samokat delivery and store operations app
Read case study
Bonus: A new form factor for delivery bags that tripled order capacity
Delivery bags for Samokat couriers
Read case study
A React Native migration that expanded the hiring funnel by 32%
New app for iOS for Samokat dark-stores
Read case study